Polar Plotting Script (Python)
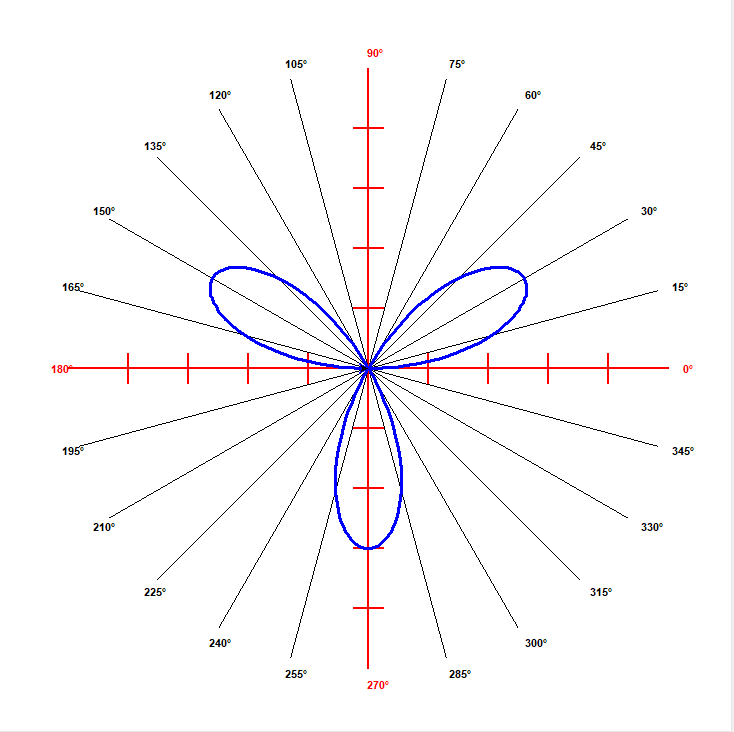
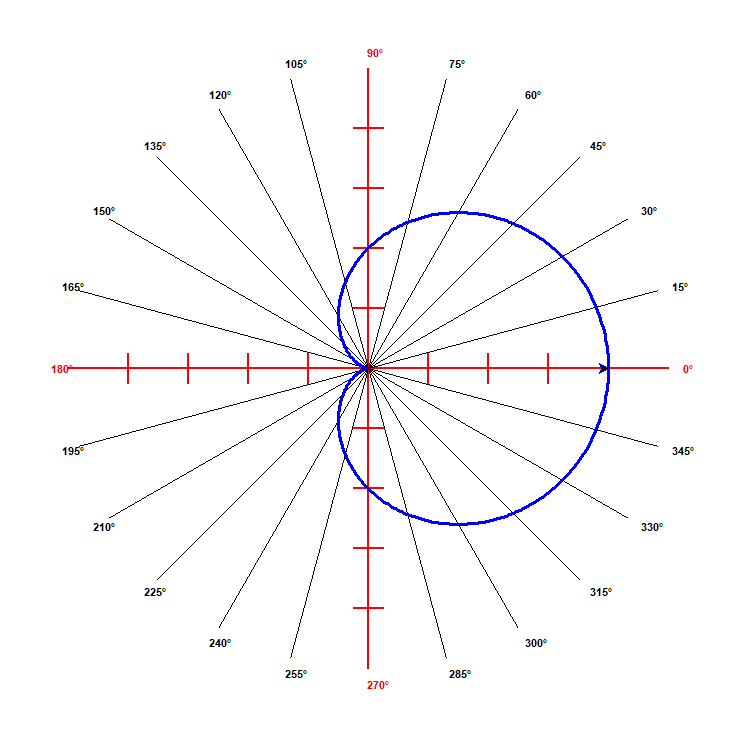
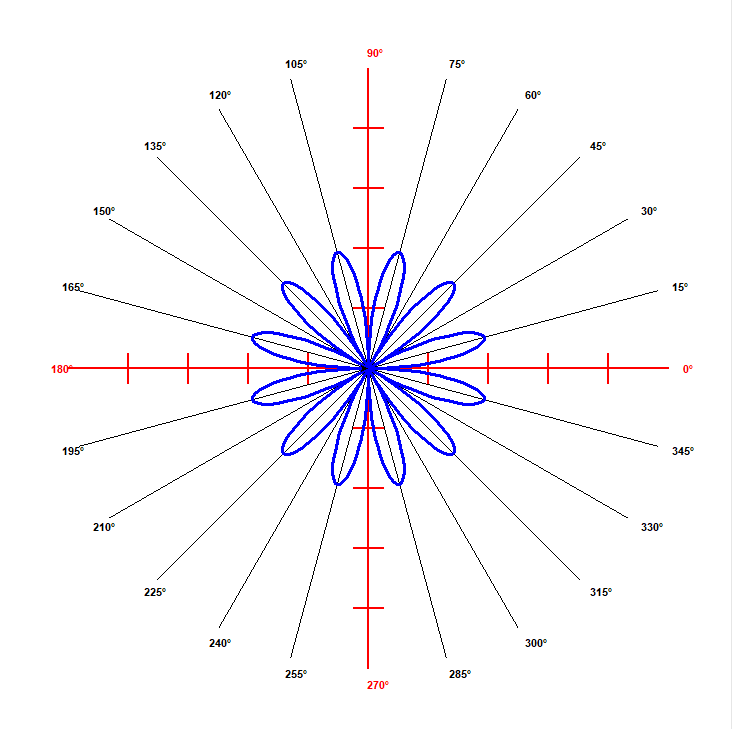
While taking Calculus III last year, my professor, Frank Servas, did an incredible job explaining the purpose and beauty of polar coordinates. I immediately wanted to attempt writing a program that would accept any polar equation and draw the graph in real time. I settled on using a reliable Python library I’d grown accustom to enjoying: Turtle. “Turtle graphics is a popular way for introducing programming to kids. It was part of the original Logo programming language developed by Wally Feurzeig, Seymour Papert and Cynthia Solomon in 1967” [1]. I had taught plenty of my tutees using Turtle and it seemed a great option. The first part of the project was situating a layout for the graph and how to display the drawings. I settled on allowing the user to see the axes being drawn to further the understanding. Once the axes were drawn, I had to decide how to render in the drawing of the graph. I worked out the polar graphing equation and from there used the math library to determine the location the turtle would head to based on taking the cos(radians) for the x position and the sin(radians) for the y position. The radians were given by iterating from 1 to 360 (all degrees of a circle) and converting each degree. Once I was able to successfully get the turtle to draw a Cardioid, I switched focus on allowing for any function to be drawn. This step was easy in theory, I had already used variables for all the graphing function’s parameters, all I had to do was enter in different data! But I wasn’t satisfied with having the user have to enter each part of the equation (the additive, the constant, the trigonometric function, and the multiple of theta) separately. The solution I settled on was to use regular expressions to parse the user’s string and route the data accordingly. This was accomplished and allows for optionality of certain parts of the equation (e.g. an additive). Overall, I’m pleased with the result and the code can be found on my GitHub (link above), but dissatisfied that Professor Servas and his students would have to run the program through a Python interpreter to see the result. I will soon be adapting the code to be served on a GitHub web page for all students and educators to use freely! Note: This program’s development was aided by Chris Webb’s article, Polar Plots in Python: https://medium.com/explorations-in-python/polar-plots-in-python-cad59d96197a Sources: [1] - https://docs.python.org/3/library/turtle.html
11-02-2020


